+91 87932 47779
Question:
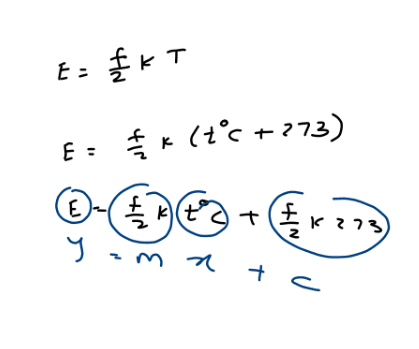
The graph which represents the variation of mean kinetic energy of molecules with temperature t°C is
Options :
Answer :
(c)
Answer Steps :
step 1