
Menu
Question:
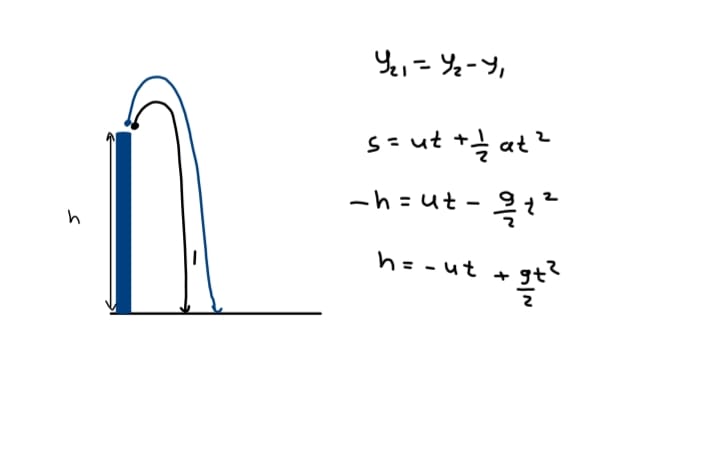
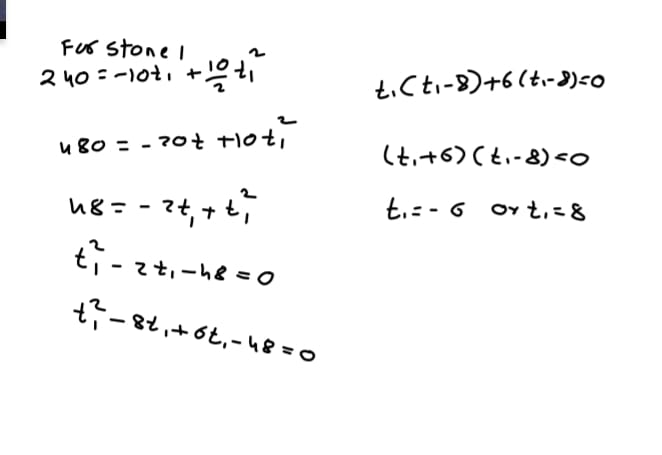
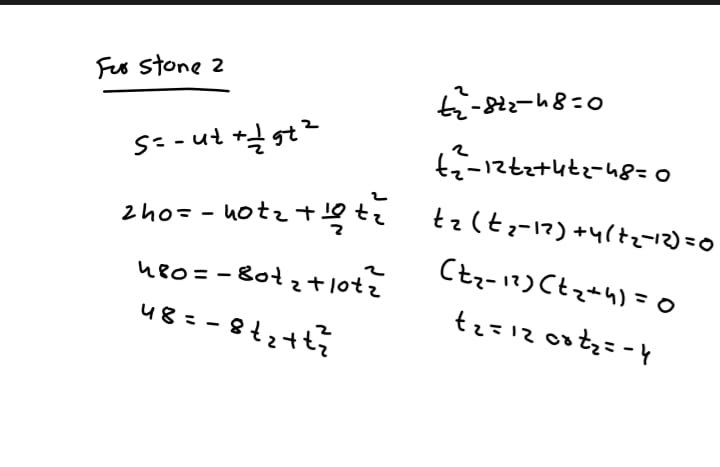
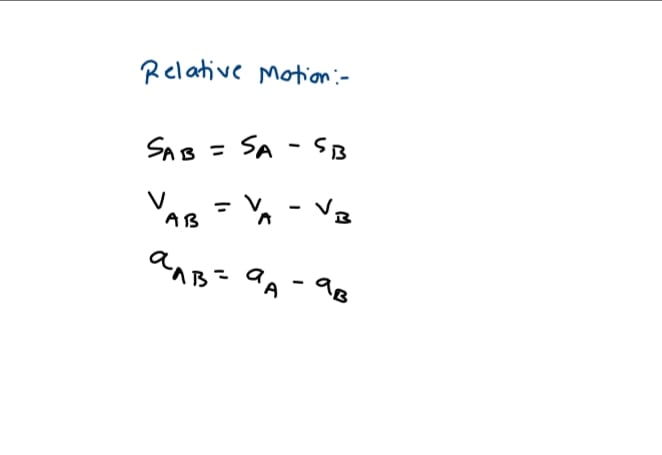
Two stones are thrown up simultaneously from the edge of a cliff 240m high with initial speed of 10 m/s and 40 m/s respectively. Which of the following graph best represents the time variation of relative position of the second stone with respect to the first (Assume stones do not rebound after hitting the ground and neglect air resistance, take g = 10m/s²) . (The figures are schematic and not drawn to scale)

Options :
Answer :
(c)
Answer Steps :
Video Tutorial

© Copyright 2024 VgyanHub & Designed by PanGrow Tech Pvt. Ltd.